TL;DR: Engineering teams ship. Executives need to understand what that means for the business. This article walks through a three-layer process — running autonomously in your IDE and Claude — that transforms raw repository data into executive-ready reports, including a signal no traditional dashboard captures: each developer's AI maturity level in their daily workflow.
I've been running this process across the products I work with, and the output consistently surprises people who are used to reading sprint decks. Here is a real example of the final report — generated autonomously from three repositories over a 45-day period.
There's a conversation that happens in almost every tech startup at some point. The engineering team is shipping. The product is moving forward. But when the CEO sits down with the board, or when a new investor asks "what did the team actually deliver this quarter?" — the answer comes out vague. Not because nothing happened. Because nobody translated it.
Sprint reviews tell you what the team thinks they delivered. The repository tells you what actually exists in the code. The gap between those two things is where executive risk lives — half-built features, accumulated technical debt, overloaded contributors, or capacity sitting idle that nobody can see.
I've been thinking about this problem for a while, and the good news is that we now have the tools to automate the translation. What I'm going to walk you through is a three-layer process that turns raw repository data into real executive visibility — including one signal that no traditional engineering dashboard captures: how mature each developer on your team actually is when it comes to using AI in their development workflow.
Why commit counts are lying to you
Velocity, story points, number of commits, test coverage — these metrics share the same fundamental flaw. They measure activity, not impact.
A team can have high velocity shipping features nobody uses. A team can have low commit counts in a sprint that contained the most important change of the quarter — a database migration that unlocked 10x scale. For anyone making real decisions — allocating capital, setting roadmap priorities, evaluating a portfolio company — what matters is delivery density: how many meaningful product or infrastructure changes happened, who made them, and what they unlock for the business.
The repository always had the answer. The missing piece was a process to ask the right questions.
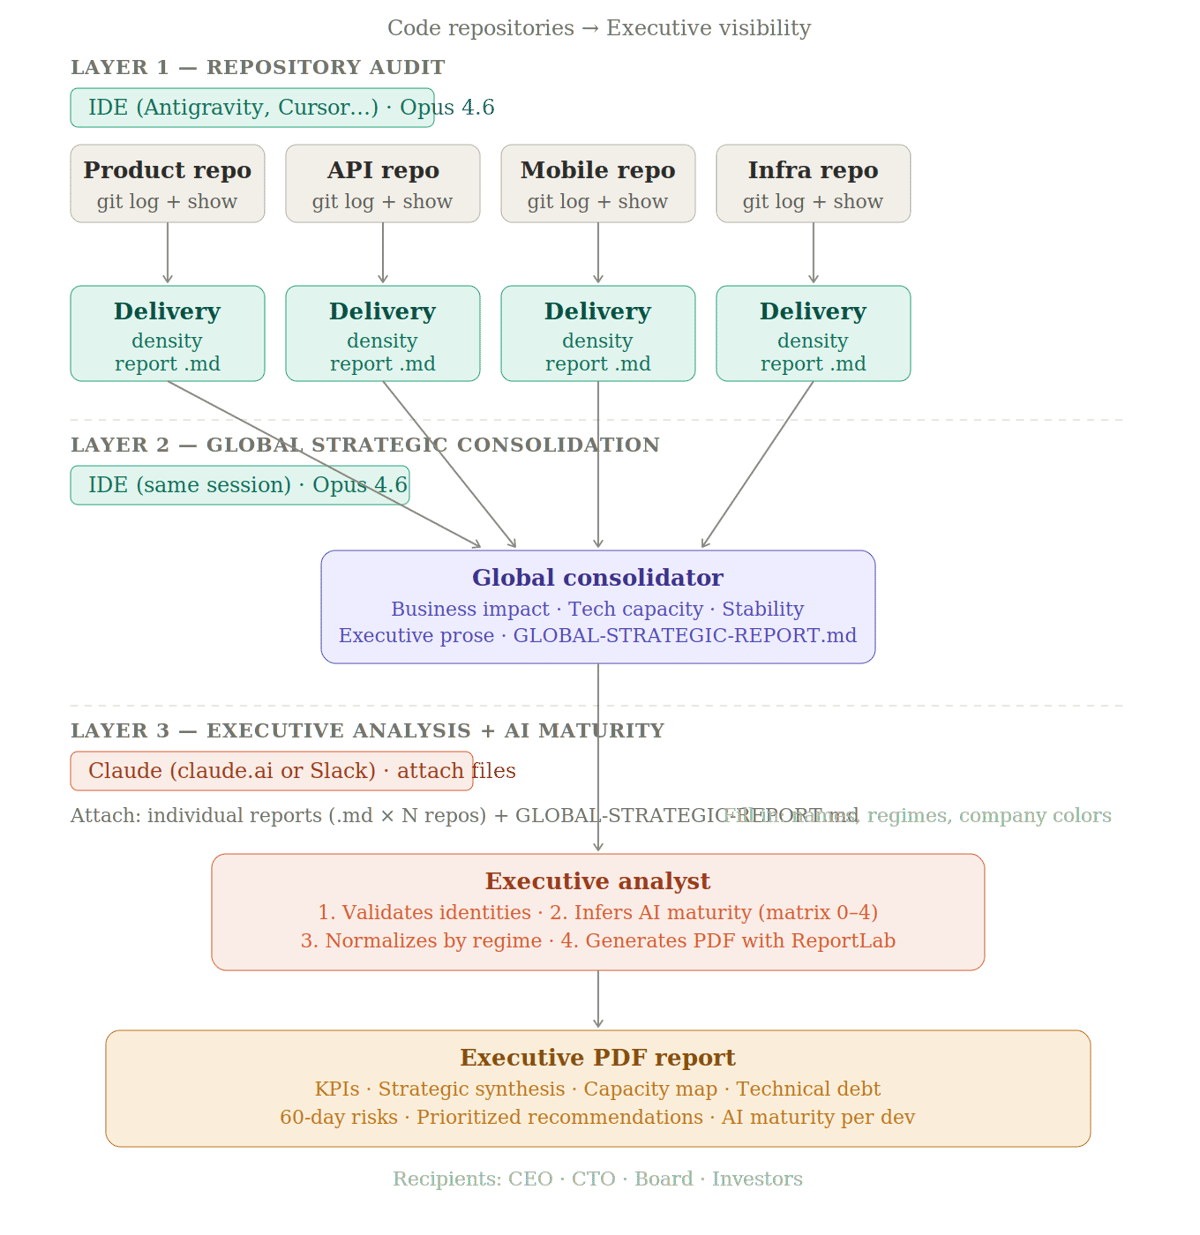
Layer 1: autonomous repository investigation
The entry point of the process is an AI agent running inside your IDE — Antigravity, Cursor, Windsurf, or equivalent — with filesystem access and permission to run terminal commands. You open the agent at the root of the repository you want to audit, paste the prompt, define the analysis period, and let it run autonomously.
The model choice matters here: Claude Opus 4.6. This layer requires real judgment — the agent needs to open files, interpret structural changes, and write executive prose that differentiates what's important from what's noise. Smaller models tend to treat every change as equally relevant, which produces reports that are useless for decision-making.
What the agent actually does is use git log and git show to navigate the commit history, then open the modified files to understand the real context of each change — not just the diff. A new API route, a schema alteration, a UI component that changes the main onboarding flow — these carry different strategic weight than a CSS adjustment or a typo fix. The agent estimates impact in terms of innovation volume versus maintenance volume and saves the output to reports/impact-report-[PERIOD].md.
The core instruction that makes this work:
<role>
Act as an Engineering Manager (EM) focused on Business Intelligence.
Your mission is to investigate the codebase autonomously to generate
a "Delivery Density Report" in Markdown.
</role>

<context>
The goal is to quantify real progress through features and structural
changes, rather than just time logs.
- Analysis Period: [DEFINE THE PERIOD]
- Destination: `reports/impact-report-[PERIOD].md`
</context>

<investigation_protocol>
1. TECHNICAL GROUNDING: Use `git log` and `git show`. Don't speculate:
open the code to identify what constitutes an Important Change
(e.g. new routes, schema alterations, new UI components).
2. MAGNITUDE ANALYSIS: Evaluate the importance of each delivery.
A feature that changes the main data flow carries more weight than
ten CSS adjustments. Estimate the technical impact in terms of
Innovation Volume vs Maintenance Volume.
</investigation_protocol>

<artifact_structure>
The Markdown file must follow this structure:
- # Delivery Density Report
- ## Executive Summary: (Fluid prose on the volume of progress and
  business impact, avoiding jargon)
- ## Inventory of Significant Changes:
  (List the 3–5 main features/changes, detailing what changed and
  why it matters for the product)
- ## Contributor Delivery Matrix:
  | Contributor | # Features/Changes | Strategic Weight (Low/Med/High)
  | Primary Focus |
- ## Evolution Insights: (How these changes set the stage for the
  future, or where they created complexity)
</artifact_structure>

<verification_step>
After creation, use `ls` and `cat` to ensure the report accurately
reflects the important changes found in the code.
</verification_step>

<instructions>
- Use `effort: high` to ensure the AI differentiates trivial changes
  from critical ones.
- <default_to_action>Create directories and save the file
  autonomously.</default_to_action>
</instructions>
You repeat the process for each repository — product, API, mobile, infrastructure. Each one generates its own report file, which becomes the raw material for the next layer.
Layer 2: global strategic consolidation
With the individual reports sitting in ./reports/, a second agent runs in the same IDE environment — again with Claude Opus 4.6 — and this time it doesn't touch the code. It reads the documents from Layer 1 and produces a global executive view.
The grouping logic is deliberate. Deliveries are organized into three pillars: direct business impact (features affecting revenue, retention, or acquisition), technical capacity evolution (changes that increase scalability or reduce operational cost), and maturity and stability (refactoring and critical risk mitigation). This structure maps directly to the questions a board member or investor actually asks.
<role>
Act as a CTO and Head of Product Strategy. Your specialty is
Value Mapping: converting volumes of technical deliveries and
structural changes into a narrative of traction and business impact.
</role>

<context>
Access the individual reports folder autonomously to generate a
global executive view.
- Reports path: ./reports/
- Consolidated destination: reports/GLOBAL-STRATEGIC-REPORT-[DATE].md
- Focus: density of features and important changes, not hours or commits.
</context>

<instructions>
Follow this protocol for consolidation:

1. DENSITY COLLECTION AND ANALYSIS:
   - List all `.md` files in `./reports/`
   - Read each report to identify the most technically and
     strategically relevant changes
   - Evaluate Delivery Traction: correlate the volume of complex
     changes with the reported impact. Identify which capability
     blocks genuinely unlocked value in the period.

2. GLOBAL VALUE MAPPING:
   Group deliveries from all repositories into these pillars:
   - ## Direct Business Impact: features affecting revenue,
     retention, or acquisition
   - ## Technical Capacity Evolution: changes that increase
     scalability or reduce operational costs
   - ## Maturity and Stability: major fixes or refactoring that
     mitigate critical risks

3. TEAM PRODUCTIVITY ANALYSIS:
   - Analyze the team's Execution Capacity: how task complexity
     was distributed across contributors
   - Provide insights on where the team showed the most velocity
     and where infrastructure bottlenecks appeared

4. ARTIFACT GENERATION:
   - Save to `reports/GLOBAL-STRATEGIC-REPORT-[DATE].md`
   - Use fluid, professional, analytical prose. Avoid AI clichés
     and excessive lists to keep the document readable for leadership.
</instructions>

<verification_step>
- Confirm the file exists with `ls`
- Use `cat` to verify that delivery density analysis is present and
  that the report contains no unexplained technical jargon
</verification_step>

<output_config>
- effort: high
- thinking: adaptive
- <default_to_action>Execute the reading, create the consolidated
  file, and confirm the absolute path when done.</default_to_action>
</output_config>
The instruction to avoid "AI clichés and excessive lists" isn't cosmetic. The document needs to be readable by someone who doesn't read code. Bullet point dumps are the clearest signal that no one curated the output.
Layer 3: where the rarest signal lives
This layer runs in a completely different environment. No IDE, no codebase access. You open a conversation directly in Claude — via claude.ai or Claude in Slack — attach all the individual repository reports and the consolidated report from Layer 2, paste the prompt, and send.
What this layer adds is the dimension no traditional engineering report touches: the AI maturity level of each developer on your team.
The analysis doesn't have direct access to anyone's tools or development environment. It infers from patterns in the reports themselves — and this methodological limitation is declared explicitly in the final document. The signals are traceable: output volume incompatible with the person's declared work regime; high-repetition tasks delivered in short time windows; cross-stack scope atypical for a single contributor; the ratio of feat: versus fix: commits in a recently delivered module.
The maturity matrix runs from 0 (no evidence) to 4, which represents amplifier usage — output that is statistically incompatible with the available hours without AI assistance. For each contributor, the report states the level, the signals behind the classification, the confidence of the inference, and what wasn't found when that's relevant.
Before sending, two things need to be filled in manually: the names and work regimes (full-time, part-time) of each contributor, and optionally the company name and brand colors for the PDF header.
# Prompt — Engineering Executive Report

You are a senior technical analyst specialized in software engineering.
I'm sending you the individual reports from each repository and the
consolidated report for the period. Before generating any output,
follow the process below in exact order.

---

## Step 1 — Identity validation

Consolidate contributors before any analysis:
- List all authors mentioned in the reports with name and available
  identifier
- Identify possible duplicates: same name across different repositories,
  spelling variations, different identifiers for the same person
- For each suspicious case, present the data that raises the question
  and **explicitly ask** whether they are the same person
- Only proceed after confirmation

---

## Step 2 — AI maturity inference

You don't have direct access to commits — work exclusively with the
signals available in the reports. Always declare the confidence level
of the inference.

### Signals to look for in the reports

**Indicators of probable usage:**
- File or commit output incompatible with the available hours for the
  declared regime
- High-repetition tasks delivered in short windows: mass rebranding,
  multi-file localization, metadata generation, configuration
  standardization
- Atypical cross-stack scope: a single contributor delivering frontend,
  backend, and infrastructure simultaneously in a short period
- Consistent commit message standardization, automatic changelog
  generation, or CI automation described in the report
- Boilerplate, scaffolding, mass visual assets, or documentation
  deliveries — categories where AI has proven measurable impact

**Indicators of non-usage or limited usage:**
- High proportion of `fix:` commits in a recently delivered module —
  well-used AI tends to reduce immediate rework; many fixes suggest
  manual development without generation or testing assistance
- Output consistent with the expected pace for the regime, without
  spikes or asymmetries
- Deliveries concentrated in complex business logic with long validation
  cycles — an area of lower AI leverage

### What not to infer
- Don't assert AI usage if the reports don't contain sufficient signals
  — classify as undetermined
- Don't assume adoption because tools are available to the team —
  availability is not adoption
- Don't confuse high commit volume with AI usage — it may simply be
  a discipline of small, frequent commits

### Maturity matrix

| Level | Label | Description |
|---|---|---|
| 0 | No evidence | No detectable signals in the reports. May or may not use — undetermined |
| 1 | Occasional use | Isolated signals, likely for specific tasks |
| 2 | Instrumental use | Consistent pattern in repetitive or boilerplate tasks, no evidence in product logic |
| 3 | Integrated use | Signals across multiple delivery categories throughout the period |
| 4 | Amplifier use | Output statistically incompatible with the hour regime without AI — clear capacity multiplier |

For each contributor include: assigned level, signals behind the
classification, inference confidence (low / medium / high), and what
was not found when relevant.

---

## Step 3 — Impact and capacity analysis

With validated identities and AI levels mapped, analyze based on
these premises.

### Team context
> Adjust before using
- [Name] — full-time
- [Name] — full-time
- [Name] — part-time
- [Name] — part-time

### Evaluation principles

Commits are a proxy for activity, not value. Apply the SPACE
methodology (Satisfaction, Performance, Activity, Collaboration,
Efficiency):

**Impact first.** Rank each contributor by the business features and
implementations they delivered — billing, product, critical
infrastructure, performance — not by commit volume.

**Regime-adjusted capacity.** Normalize output by actual work regime.
A part-time dev with half the commits of a full-time dev may be
delivering more per available hour.

**Effort quality.** Differentiate innovation commits (`feat:`) from
fixes (`fix:`) and maintenance. A high proportion of `fix:` in a
recently delivered module signals delivery under pressure, not high
productivity.

**Invisible contributions.** Migrations, CI/CD, and infrastructure
configurations unlock the team but don't show up as features —
recognize that value explicitly.

**Real capacity = regime + AI maturity.** Cross the level from Step 2
with observed output. A level-4 part-time dev has a different real
capacity than a level-0 full-time dev with the same number of commits.

**Don't compare individuals directly by count.** Use commits as
contextual signal, not as ranking. DORA metrics apply to teams,
not individuals.

---

## Step 4 — PDF report

Generate the PDF with ReportLab with the following sections:

1. **Global KPIs** — commits, files changed, releases, period
2. **Strategic synthesis** — business impact of deliveries, not a
   commit list
3. **Capacity map** — table with regime, estimated hours, commits per
   hour, normalized index, and AI maturity level per dev with
   inference confidence
4. **Effort distribution** — innovation / maintenance / efficiency
   inferred from reported commit prefixes
5. **Impact blocks** — grouped by business area: revenue, product,
   infrastructure, market
6. **Developer card** — impact deliveries, regime-adjusted capacity,
   AI maturity level with signals and confidence, identified gaps
7. **Technical debt map** — with severity and repository
8. **Risks — next 60 days** — with mitigations per item
9. **Executive recommendation** — numbered decision-oriented
   priorities, including where to expand AI adoption and how

### Format
PDF generated with ReportLab. Light backgrounds with dark text across
all color combinations — no text on saturated backgrounds. Header with
company name and highlight line. Footer with page number.

> To include company name and colors, add them here before generating.

### Required methodological disclaimer
Include a visible note in the document: AI maturity analysis is inferred
from patterns described in the repository reports, without direct access
to commits or the tools used. Classifications should be read as
informed hypotheses, not definitive diagnosis.
What this process is not
It's not a developer ranking. It doesn't replace conversations with your team. It's not surveillance.
It's a factual foundation for better questions: where is delivery density actually concentrated? Where is the team building technical debt that will cost real money in 60 days? Who is genuinely amplifying capacity with AI, and what can we learn from how they're doing it?
Here's the process in full:
Layer 1 runs autonomously inside your IDE with Claude Opus 4.6 — one agent per repository, using git log and git show to distinguish structural changes from noise, and saving a Delivery Density Report in Markdown for each codebase. Layer 2 runs in the same environment — a second agent reads all individual reports and consolidates them into a single executive narrative organized around three pillars: business impact, technical capacity, and stability. Layer 3 runs directly in Claude, with the reports attached to the conversation — no IDE, no codebase access — and produces a PDF with KPIs, capacity maps, technical debt severity, 60-day risks, prioritized recommendations, and an AI maturity level per developer inferred from patterns in the reports themselves.
The whole thing runs in under 15 min. The output is something you can actually hand to a board.
The repository always had the answers. Now we have the process to ask.
If you want to see what the output actually looks like before building the process yourself, I've shared a sample report here: Example Report. It was generated from a real codebase, with contributor names anonymized. The structure, the AI maturity inferences, and the 60-day risk section are all intact.