Hi there! Whether you're a Technical Program Manager (TPM), Project Manager (PM), or another title, your ability to communicate about projects, especially Data Flow Diagrams (DFD), is crucial.
Today, let's dive into the art of project talk – what your different teams are looking for and how you can ace these discussions.
BTW, Here's my course on HOW TO actually get a TPM job! You can grab here: https://nik-tpm-school.teachable.com/p/course
- Identification of Data Sources: Pinpoint where data originates, whether it's internal (employee devices, servers, databases) or external (client information, third-party integrations).
- Data Movement: Track how data moves within the organization, including data transfers between departments, servers, applications, and cloud services.
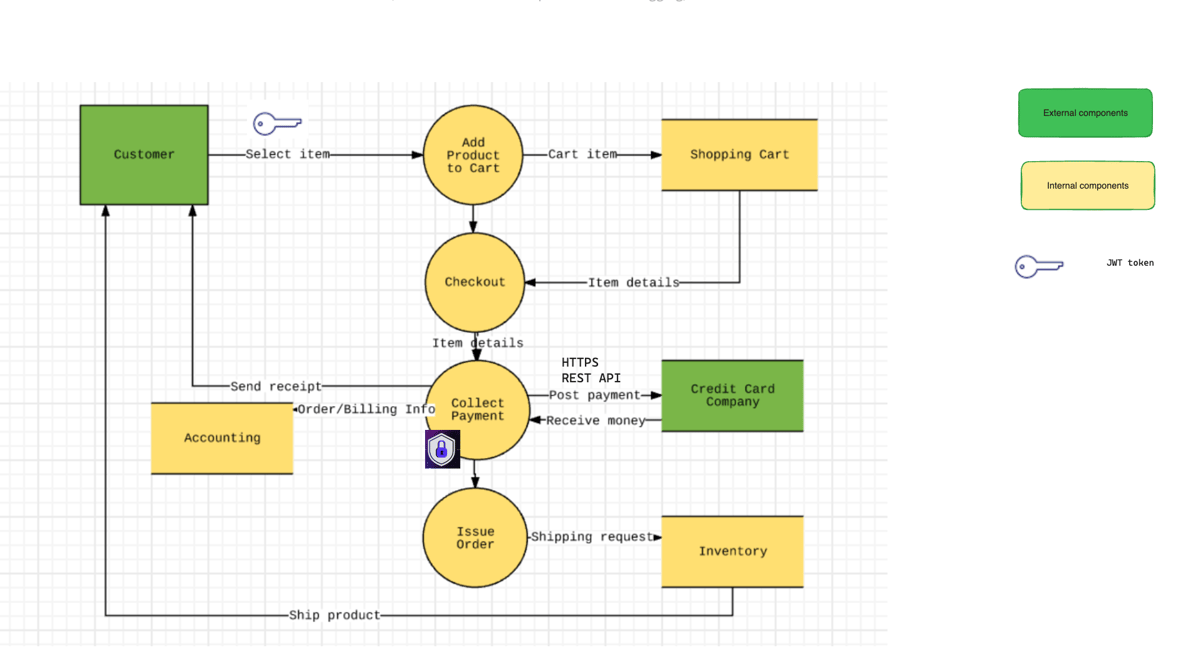
- Data Access Points: Highlight access points where individuals or systems interact with data. This includes user interfaces, APIs, and any external connections.
- Security Controls and Measures: Highlight security measures implemented at various stages of data flow—encryption methods, authentication protocols, and intrusion detection systems.
- Data Storage Locations: Specify where data is stored—on-premises servers, cloud storage, or other platforms—and how it's secured during storage. (e.g. AES-256)
- Risk Points and Vulnerabilities: Show there’s no potential weaknesses or vulnerabilities in the data flow if any, such as unencrypted data transfer or outdated software (static and dynamic code analysys reports have to be conducted).
- Regulatory Compliance Points: Note where data flow intersects with regulatory requirements (e.g., GDPR, HIPAA) and ensure compliance measures are in place.
- Incident Response and Recovery Processes: Outline procedures for handling security incidents or breaches at different stages of data flow, including notification processes and recovery plans.
- Documentation and Governance: Ensure documentation and governance structures are in place to monitor, review, and update the data flow diagram regularly.
Conclusion 🚀🔒
Talking about projects, especially DFDs, is an art that combines communication, empathy, and collaboration. By understanding your team's perspective, breaking down complexity, and fostering open dialogue, you pave the way for project success. Remember, effective communication isn't just about transmitting information; it's about creating a shared understanding that propels the entire team forward. Keep those project conversations alive and thriving! 🌟
Note: During our mentoring sessions..
..I focus on highlighting key red flags to steer clear of when communicating through diagrams. Together, we explore various diagram types, including High-Level Architecture Diagrams, to elevate your technical skills and ensure a seamless performance in interviews. Let's delve into the nuances of effective diagram communication to take your tech expertise to new levels.
DFD key theory points
A Data Flow Diagram (DFD) is like a map that shows how information moves through a system or process. It uses symbols to represent the people and steps involved in transmitting data accurately.
Imagine it as a way to visualize how information enters a system, what the system does with it, and where it goes next. The complexity of a DFD depends on the system it represents, and there are tools available to make creating one easier.
DFDs are mainly used to show how data flows in a business information system. Unlike other diagrams, like workflow diagrams or flowcharts, DFDs specifically focus on data and information flow.
To distinguish between a flowchart and a DFD, you can look at the arrows. In a flowchart, arrows indicate the order of events, while in a DFD, arrows show how data moves.
When making a DFD, there are some rules to follow:
- Directionality: Ensure data flows in one direction—from input to output.
- Connectivity: Every data flow should lead to a process or a data store to clearly define the source and destination of data.
- Naming conventions: Keep labels for processes, data stores, data flows, and external entities consistent and clear for easy understanding.
- Process hierarchy: Clearly distinguish broader functions from more detailed ones to simplify the system's complexity and show a logical flow.
DFDs use standardized symbols to represent different components:
- External entity: These are sources or destinations of data outside the system, like actors or sources.
- Process: Represents the system's functions, transforming incoming data into usable output.
- Data store: Stores data in the system, usually represented as files.
- Data flow: Pipelines through which data is transferred, often shown as arrows and connectors.
So, in a nutshell, a DFD is a visual guide showing how data moves through a system, using symbols to represent different components and following some rules to ensure clarity and accuracy.
How to Create A DFD
- Inputs and Outputs: Begin by identifying the inputs and outputs for each process you want to include in your diagram. Make sure every process has at least one input and one output to ensure completeness.
- Start at Level 0: Begin your diagram at Level 0 to get an overall understanding of the entire system. This high-level view helps you decide if you need to delve into more detail in the subsequent levels.
- Move to Level 1: Transition to Level 1 to add more details to your diagram. Here, you can flesh out the structure by incorporating additional processes and steps. Use the standard data flow diagram symbols and shapes discussed earlier.
- Add More Levels as Needed: Repeat the previous step as necessary, going deeper with each level to focus on specific systems or processes. While there's no strict limit on the number of levels, keep in mind that the goal is to keep the diagram easily understandable. Share your diagram with team members for feedback, questions, and suggestions. Collaboration can be done on a shared canvas in real-time.
Types of Data Flow Diagrams
Data flow diagrams come in two types based on the flow they visualize: logical data flow diagrams and physical data flow diagrams. Each type serves a specific purpose with unique benefits.
Logical Data Flow Diagram
Logical data flow diagrams focus on the activities and processes of a business. They answer the "what" by providing a graphical representation of business functions. These diagrams depict what a business does, offers, and aims to achieve. They outline business events and the information or data needed for these events to occur.
Using logical data flow diagrams is valuable for mapping out the flow of business actions. They aid in understanding the functionalities a business currently has or plans to incorporate.
Physical Data Flow Diagram
On the other hand, physical data flow diagrams illustrate the implementation of business systems. They address the "how" by showing how data moves through a system and how the system operates. This type of diagram includes elements like files, software, and hardware.
Physical and logical data flow diagrams offer different perspectives of the same data flow. When used together, they provide a comprehensive understanding of an entire process.
When to Use a Data Flow Diagram
Originally designed to depict data flow in computer systems, data flow diagrams have evolved and find applications in various industries during different stages of ideation and design. They are particularly useful for companies heavily reliant on data and information.
Examples of Usage:
- Software Engineering:Data flow diagrams are employed by software engineers to design software foundations and architecture before diving into the coding stage. These diagrams serve as ongoing system analysis tools, helping measure progress and implement improvements throughout the development process.
- Data flow diagrams are employed by software engineers to design software foundations and architecture before diving into the coding stage. These diagrams serve as ongoing system analysis tools, helping measure progress and implement improvements throughout the development process.