Where we are starting
I built my app during weekends and evenings since the start, so I was aware that not all code is probably as clean as it should be. When I started getting Google alerts and even some customer reports that some of the views felt sluggish, I started to get worried that the years of tired coding finally came back to bite me.
The Google Web Vitals screen on the Google Search Console is the first place I checked. It will show and bundle all URLs that are slower than the “acceptable” 4 seconds on a mobile phone, which can give you a great idea on where to start.
In my case, this was the case on quite a few of my pages:
- The mentor profiles
- The mentor search/marketplace
- The blog
- Some landing pages
I went over to Pingdom to see whether I could nail that problem down further. Were my files too large? Did some JS prevent those screens from loading? Well, yes – all of the above… but fixing or optimizing that gave me a speedup in the area of 0.1 seconds, not the 2-3 seconds I was looking for.
The Debug Toolbar
So, for Django, we need to go into our local environment and install the Django Debug Toolbar, a handy helper when it comes to issues like that. I still remembered using debug toolbar from my times as a “professional” Django dev, and installing it for my side-project felt right at home.
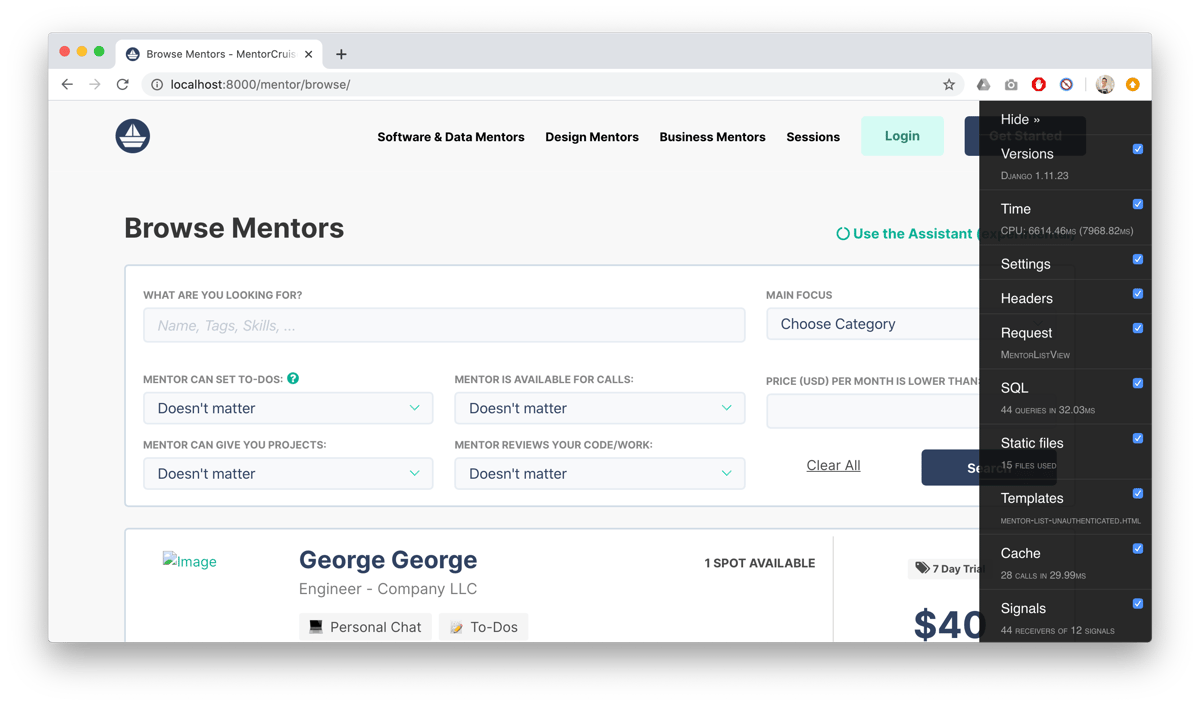
The debug toolbar already displays a fair share of great information, but for our cause, we also want to see template timings and use the profiling panel, which are not enabled by default. In my settings.py I therefore at least add:
DEBUG_TOOLBAR_PANELS = [,
        'debug_toolbar.panels.timer.TimerPanel',
        'debug_toolbar.panels.headers.HeadersPanel',
        'debug_toolbar.panels.request.RequestPanel',
        'debug_toolbar.panels.sql.SQLPanel',
        'debug_toolbar.panels.cache.CachePanel',
        'debug_toolbar.panels.profiling.ProfilingPanel',
        'template_timings_panel.panels.TemplateTimings.TemplateTimings',
    ]
This gives me the debug toolbar with everything I need and removes everything that is not required for our exercise here.
Depending on version, the template timings are built-in or need to be installed. If you face an issue, just follow the installation directions.
Hotspot: Templating Engine
If you are running into similar issues, my advice is to look at the number of template tags and variables you are using first. Here’s the thing: Django’s templating engine isn’t necessarily fast or built to scale. As you start having views with a lot of info on it, those views will take a lot longer to load.
Especially {% for %} and {% include %} are known to be slow out of the box. In my case, I was doing includes IN a for loop, oh my! The absolute values I am showing you here aren’t correct (they run on an extremely slim Macbook in Debug mode), but as you go into your templating timings you will see: Those includes and for loops take a LOT of time.
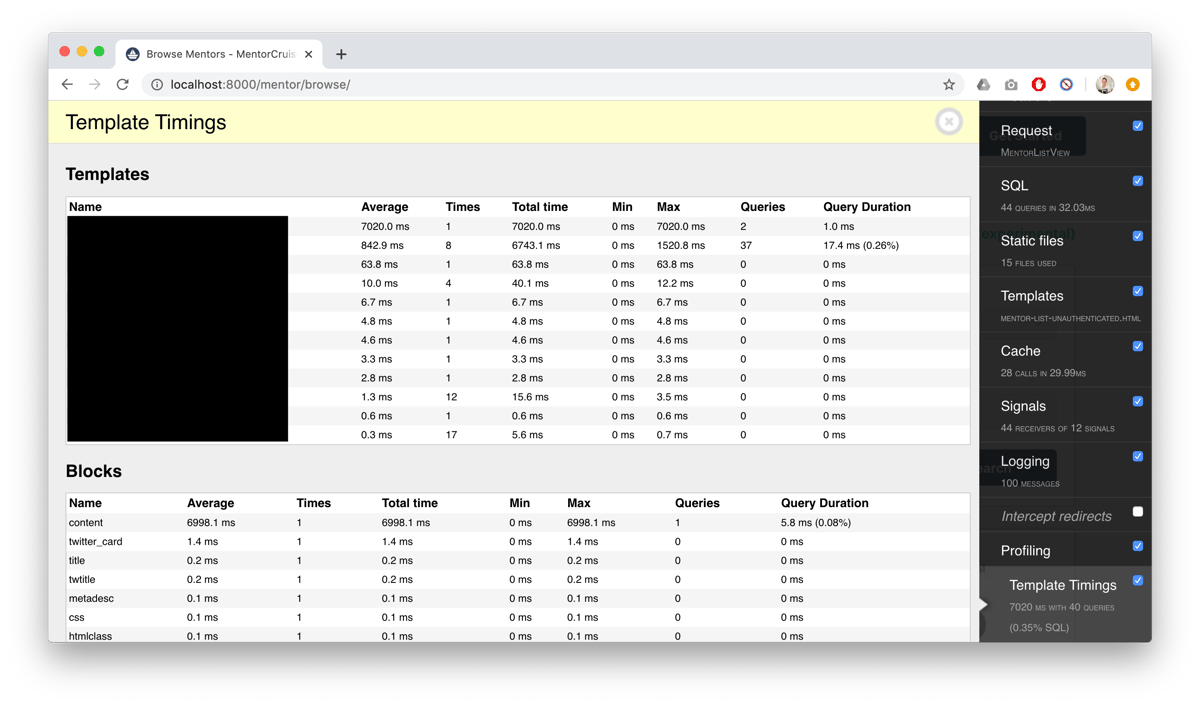
As you can see, I am loading my pretty heavy template and it takes 7 seconds (again, the absolute values do not matter here). I then include this little bit of HTML code that almost takes a second to include by itself, and then do that 8 times!
I ended up leaving those for loops and includes, as I was able to speed the loading time up with the following points, but if it’s an issue for you, it’s time to let off the loops and render things directly on the frontend.
A bonus was that I was already using pagination. If I wasn’t doing that and loading all 300 mentors, this would have taken almost 5 minutes to load, yikes!
Reducing the use of expensive methods and @property
So, why do these includes take so much time in the first place? Sure, Django’s templating engine is slow, but not THAT slow, right?
A great thing about Django’s templating engine is that you can write whatever method or @property you want in your models, and then use that in your template directly. That can also haunt you, when those properties are expensive to calculate and you use them often. I did that a lot, which caused over 100 queries to the database for EVERY single one of those includes. I reduced this a lot by:
- Not using the same method multiple time, but saving the result somewhere
- Running expensive calculations (e.g. related users) async and periodically and saving it
- Using cache for expensive calculations (see later)
- Using fewer variables
I ended up only doing 12 queries to the database after that. Still plenty, but things felt quicker overall.
Jinja2
The overall sentiment seems to be that you should jump to Jinja2 in these situations at some point. Jinja works together with Django really closely. It’s a very similar way of working and syntax, and the migration consists of about 5 changes you will have to make to loops, function calls and similar.
That change is quite easy to do but can break a lot of things. I am still in the process of pulling this through, but it should enable quite an amazing speedup.
Embrace Frontend/Backend split
The Django Rest Framework is one of the most amazing API engines out there. If your app can do it, and if you have the resources for it, now would be the time to turn your backend into an API, and build your frontend in something newer, be it Vue, React or anything else that you would like.
There is only so much you can do from Django’s side or by switching to Jinja2. Delivering all needed info through an API seems annoying at first, but it also enables you to build fast, smooth clients.
Cache Everything!
Django has an amazing caching framework and I feel foolish for not using it earlier.
I have my app behind Cloudflare and assumed that something, somewhere should be cached on there. Utilizing Django’s framework and Memcached I was able to cache exactly what I wanted to cache, such as landing pages, blog posts and even very specific calculations (like the reaction/reply time of each mentor, which is an expensive calculation) and return them from RAM, rather than pulling them from somewhere else.
To cache specific landing pages, I made use of the cache_page decorator in my URLs file as follows.
urlpatterns = [
    path('foo/<int:code>/', cache_page(60 * 15)(my_view)),
]
To cache certain includes and template fragments with a lot of DB calls in them, I used the template tag.
{% load cache %}

{% cache 21600 mentor mentor.user.username %}
    ....
{% endcache %}
Finally, to cache certain expensive calculations, I used the low-level API
from django.core.cache import cache
if cache.get('something', None):
    ...
else:
    s = expensive_calculation()
    cache.set('something', s, 21600)
This works extremely well if certain content isn’t changing regularly. I used this for my blog, for mentor profiles and the landing page. Loads blazingly fast once it’s cached!
Re-visit the basics last
I think before you even try to increase your resources, think about scaling up, load balancers, workers, CDNs & co. you need to get those points right. Especially if you use RAM-based Memcached as a caching framework, you will see how much memory that soaks up, but also how much load on your DB is saved. In my case, I had to take a few more steps after.
I ran out of RAM
So, I deployed my changes at some point, and everything seemed to go great. Things loaded faster, Google got happier and everything seemed right. Sometime after the first day, my chat server continued to go down. Then the caching stopped working. I restarted everything, it worked again fine, and then the same thing. What happened?
Turns out, as my cache grew, my RAM got increasingly sparse. Linux started killing processes to stay alive, and it hit my chat server first, every single time.
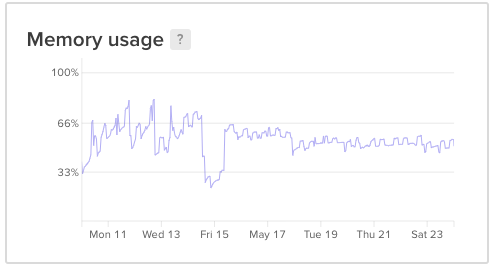
If you look at that graph prior to Friday the 15th, you will see memory usages lashing out and being kind of unstable. The crazy thing here is that at this point, I actually only had 50% of the RAM available, compared to the time after (because I scaled the server). So whenever that memory goes over 50%, it actually went over 100% and started killing processes.
So on Friday 15th, I stopped the server, doubled it’s RAM and made it go back up. Since then, it has been happy at around 50-60% usage. Yay!
I scaled up my Gunicorn workers
The bigger server brought another benefit: More CPU cores. I am running a pretty standard nginx+gunicorn setup, so I was able to scale up my workers.
Gunicorn workers are the small little processes that take requests and forward them to the right player internally, take the results and return it. If you have one worker, that one is responsible for EVERY request coming in. If you have three, they can split the work. If you have 6, but over 100 people on your page at the same time, things can get slow.
The recommendation is to have 2-4 workers per CPU core, so more cores means more workers. Yay!
I set up monitoring to look at my speeds and have a plan for the future
I am using Pingdom to test my speed regularly, and use the DigitalOcean daemon to tell me if I am running out of RAM. That should help me knowing when it’s time to optimize things again.
I have not pulled all triggers yet to make things faster:
- I can use
RawSQLfor some of the more complicated queries that are not optimized - I am not making use of many database optimizations (because that hasn’t been a problem)
- I could move to a Vue/React+Rest API setup, or at least use Jinja2
- There is definitely more to cache
- I haven’t done much on the frontend site, I am not even minifying my static files (because I haven’t figured out a good way to do so without a lot of hassle, mainly). That costs me some time and data.
- Except for some security updates, I am using the same packages from around 2 years ago. I am sure Django itself might be faster now in some of these cases.
If you are developing Django apps (stay strong!), I hope that this can help you a little bit with starting to speed up your app. In my case, these changes have provided a 3x speedup for the two worst cases (mentor profiles and landing pages).
I have been doing this for a few years, but I don’t really consider myself a Django expert. If you have inputs about how to make it even faster, I am certainly all-ears 😁