Intro
Whether it's conversion rates on a webpage, user engagement on a software platform, or click-through rates in an email campaign, A/B testing provides a systematic approach to understanding the impact of changes on user behavior. However, it's alarming to note that despite the proven efficacy of A/B testing, it remains an underutilized or often misapplied tool in many companies.
A frequently overlooked aspect of A/B testing, that can profoundly impact the validity of the results, is the determination of the sample size. Some companies, for instance, rush to conclusions based on inadequate sample sizes that fail to provide reliable results. Alternatively, others might overcompensate, unnecessarily allocating resources to oversample and test minuscule variations that have little practical significance.
Sample Size Estimation
Crucial to the efficacy of A/B testing, however, is a frequently overlooked aspect – the determination of sample size. Estimating an appropriate sample size is not just a statistical nicety; it underpins the reliability and accuracy of A/B testing outcomes.
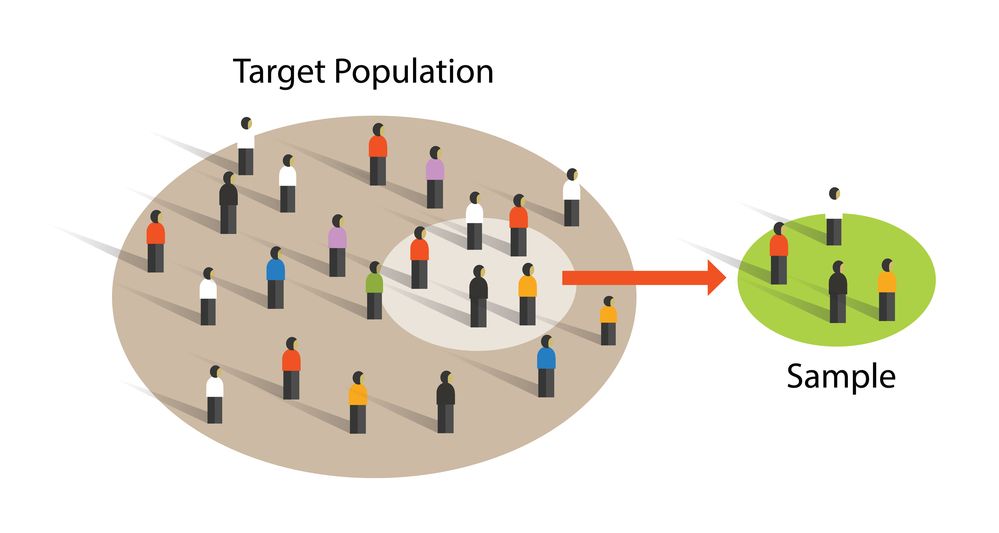
A/B testing is fundamentally an exercise in statistical inference. The goal is to make a decision about the population at large based on the behavior of a selected sample. If the sample size is too small, the test may lack the statistical power to detect a real difference between A and B, leading to a Type II error. In contrast, if the sample size is too large, it may waste resources and could potentially identify a statistically significant but practically meaningless difference, a scenario often referred to as a Type I error.

- Statistical power, often set at 0.8 or 80%, is the probability that the test will correctly reject the null hypothesis when the alternative hypothesis is true. Essentially, it measures the test's sensitivity to finding a difference when one genuinely exists.
- The significance level, usually set at 0.05 or 5%, defines the probability of rejecting the null hypothesis when it is true, meaning it controls the risk of a Type I error. The interplay between statistical power, significance level, and the magnitude of the effect you wish to detect defines the necessary sample size for the test.
How to Calculate the Sample Size
- The baseline conversion rate (the current rate at which the desired outcome occurs)
- The minimum detectable effect (the smallest difference between versions A and B that would be meaningful to detect)
- The statistical significance level (the probability of rejecting the null hypothesis when it's true, often set at 0.05 or 5%)
- The statistical power (the probability of rejecting the null hypothesis when the alternative is true, often set at 0.8 or 80%)

- n is the sample size
- Z_α/2 is the critical value of the Normal distribution at α/2 (for a confidence level of 95%, this is 1.96).
- Z_β is the critical value of the Normal distribution at β (for a power of 80%, this is 0.84).
- p1 is the baseline conversion rate
- p2 is the expected conversion rate after the change (p1 + minimum detectable effect)
Note that this formula provides the sample size per group (A or B). Therefore, you would need to double this number to get the total sample size.
One important note is that the formula assumes that your data follows a binomial distribution (which is a reasonable assumption for most conversion rate A/B tests), and that the minimum detectable effect is a relative change from the baseline conversion rate. If your A/B test involves a different type of data or a different type of effect, you may need to use a different formula or approach to calculate the sample size.
A/A Testing
A/A testing, while less well-known than its counterpart, A/B testing, serves a unique and important role in the world of data-driven decision-making. In an A/A test, instead of comparing two different versions (A and B) of a web page, email, advertisement, or other variable, you compare the same version against itself. The purpose of an A/A test is not to determine which version is superior, as they are identical, but to ensure the testing environment is sound and the results are not influenced by confounding variables or biases.
A/A testing can be seen as a sort of diagnostic tool for your testing procedures. It provides a way to check for anomalies in your testing process, evaluate the presence of false positives, and verify the accuracy of your statistical methods. If there's a significant difference in the results of an A/A test, it could indicate a problem with the testing procedure, tool, or data collection method. In this way, A/A testing plays a pivotal role in ensuring the robustness and reliability of your A/B testing infrastructure.
During an A/A test, you should not see a statistically significant difference between your two identical variants if your sample size is adequately determined and your testing framework is set up correctly. If you observe such a difference, it may indicate an issue with either the testing procedure itself or the sample size.
The sample size is critical here. If your sample size is too small, you may lack the power to accurately detect whether there is a difference or not, which could lead to false negatives. On the other hand, if your sample size is too large, you may end up detecting differences that aren't practically significant, leading to false positives.
Conclusions
Not taking care of the sample size can result in misleading outcomes. For instance, an underpowered study (too small sample size) may lead to false negatives, implying that there is no significant difference between A and B when, in fact, there is. On the other hand, an overly powered study (too large sample size) can lead to false positives, suggesting a significant difference when there is none of practical importance.


