Bring in a vetted expert to train your team with a hands-on, interactive workshop. Flexible formats, proven results, and zero hassle – we handle the matching so you can focus on learning.
Tell us about your team and we'll reach out within 24 hours.
Our team will reach out to within 24 hours.
Our workshop hosts work at



























Skip the one-size-fits-all sessions. Get expert instruction that's relevant, hands-on, and made for your team.
satisfaction rate
faster goal achievement
available workshop hosts

"Andrei has been an amazing mentor, helping me navigate the challenges of managing an engineering team, modernising our legacy SaaS platform and moving us into the era of AI software development."

We're not a generic training marketplace. Every workshop host on MentorCruise is a vetted professional with real-world experience at top companies.

Every host goes through a rigorous vetting process. Only 8% of applicants are accepted, so you're always working with the best.

Workshops start from $250. No hidden fees, no long-term contracts. Pay per session or negotiate a package for your team.

Tell us your goals and team size – we'll match you with the right host, coordinate scheduling, and make sure everything runs smoothly.

No cookie-cutter content. Hosts tailor every session to your team's industry, skill level, and specific challenges.
From first inquiry to post-workshop follow-up, we handle the logistics so your team can focus on learning.

Fill out the quick form or book a discovery call. Share your team's goals, skill gaps, and preferred format – whether it's a focused 2-hour session, a half-day deep dive, or a full-day intensive.
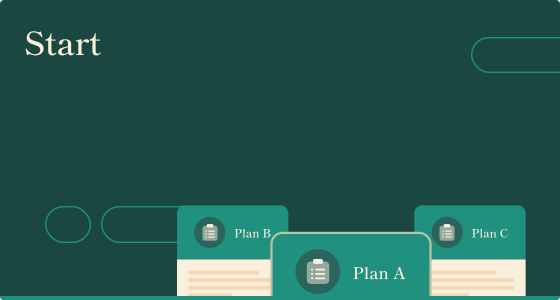
Based on your requirements, we shortlist 2-3 workshop hosts from our vetted network. You'll get their profiles, past workshop topics, and reviews – then pick the one that fits best.

Your host tailors the curriculum to your team's context. They'll align on agenda, exercises, and outcomes ahead of time so there are no surprises – just a session that delivers exactly what you need.

Your team gets a hands-on, interactive session led by a real practitioner. After the workshop, you'll receive materials, action items, and optional follow-up sessions to reinforce what was learned.
Choose a format that fits your team's needs and schedule. Every workshop is fully customizable.
Developers in METR's randomized trial believed AI had made them 20% faster while they were measurably running 19% slower. That is a gap of roughly 39 points between what the people doing the work reported and what the clock recorded. The instrument most engineering leaders reach for when the CFO asks whether the tools paid off - asking the team - is the one instrument with a documented error that large.
The study was narrow, and its limits matter more than its headline. Sixteen experienced open-source developers worked 246 real issues on mature repositories they had known for around five years, using Cursor Pro. That is the hardest available condition for an AI coding assistant, and METR, an independent non-profit AI evaluations organization rather than a vendor, has since said the result is out of date.
What survives is the gap itself, and it deserves a name - the perception gap. Around 90% of software professionals now use AI and more than 80% believe it has increased their productivity, while 30% report little or no trust in the code it produces (DORA, 2025). Most engineering teams are running on belief and reporting it as measurement.
Every metric whose numerator is "code produced" dies the day an AI coding assistant lands, because AI inflates output counts without anyone deciding to cheat. What holds is change failure rate, delivery stability, review cycle time, percentage of time on new capabilities, and same-engineer throughput against a pre-AI baseline. Sorting a dashboard into the two piles costs nothing.
Here is the split.
| Metric | What it measures | What AI does to it | Verdict under AI |
|---|---|---|---|
| Lines of code and commits | Volume of code written | Inflates it directly - the assistant writes the lines | Breaks |
| Pull request count | Number of changes shipped | Inflates it - PRs get smaller and more numerous | Breaks |
| Story points | Estimated effort completed | Inflates it - estimates were calibrated on pre-AI effort | Breaks |
| AI suggestion acceptance rate | How often engineers accept completions | Measures tool usage, not output value | Breaks |
| Seats active and license utilization | Who has the tool open | Measures procurement, not delivery | Breaks |
| Self-reported time saved | What the team believes happened | Carries a documented 40-percentage-point overestimate | Breaks |
| Change failure rate | Share of deployments that fail | Nothing - you cannot improve it by writing more code | Holds |
| Delivery stability and time to restore | How fast a broken change recovers | Puts it under pressure, which is the signal | Holds |
| Review cycle time | Time from PR opened to merged | Shifts load into review, so movement here is real | Holds |
| Percentage of time on new capabilities | Feature work against maintenance work | Nothing directly - the ratio is the point | Holds |
| Same-engineer throughput against own pre-AI baseline | One engineer against their own history | Nothing - the confounds are controlled out | Holds |
Report the metrics in the bottom half and retire the ones in the top, because a number that rises on its own is not evidence. Measuring developer productivity was never a single-metric job - the SPACE framework made that argument before AI arrived: never measure productivity with a single metric, and never with activity alone (Forsgren, Storey et al., ACM Queue, 2021).
DORA's four keys and DX Core 4 both build on it, and all three balance speed against quality rather than reporting either on its own.
Goodhart's law explains the whole split. When a measure becomes a target, it ceases to be a good measure. The usual worry is gaming, where an engineer notices that commits are being counted and starts committing more.
AI removes the decision from the equation. Nobody has to choose to inflate lines of code when a model produces them by the hundred, and commit counts, PR counts, and story points all rise as a side effect of switching the tool on. They still move, so they still look like evidence.
Change failure rate is the one number an AI coding assistant cannot inflate, which is precisely why it belongs on the CFO slide next to any speed claim. You cannot improve your failure rate by writing more code. If anything, more code is how you make it worse.
That is not a hypothetical. GitClear's analysis of 211 million changed lines found cloned lines rising from 8.3% of changed code in 2021 to 12.3% in 2024, while refactored lines fell from 25% to under 10%. GitClear is a commercial code-analytics firm, and 2024 was the first year on record where copy-paste exceeded moved code.
That correlation is industry-wide rather than a controlled attribution, so it does not prove AI caused the shift. It does tell you what to watch. If velocity is up and code churn is rising while refactoring collapses, part of the "gain" is technical debt borrowed against next year's maintenance budget, and a leader who reports velocity without duplication is handing their CFO half a P\&L.
The research does not agree with itself, and the disagreement is not noise. Published findings run from 55.8% less time on a greenfield task, to 26.08% more tasks completed across 4,867 developers, to roughly 21% less time at Google, to 19% more time per issue on mature codebases. Those studies measure different constructs with different seniority mixes, which is why they can all be right at once.
| Study | Year | Sample | Effect on time to complete | How to read this row |
|---|---|---|---|---|
| Peng et al., GitHub/Microsoft | 2023 | 95 devs | 55.8% less | Controlled experiment on one greenfield HTTP-server task in JavaScript, using GitHub Copilot - the best possible case for AI. Two of the authors work for the tool's vendor. |
| Cui et al., Management Science | 2025 | 4,867 devs | No time figure | Three RCTs at Microsoft, Accenture and a Fortune 100 manufacturer, reporting 26.08% more tasks completed. Throughput, not time per task - which is why this row carries no time figure. Gains concentrated in less experienced developers. |
| Paradis et al., Google | 2024 | 96 devs | 21% less | Randomized trial on internal Google tooling, measuring time on task. Wide confidence interval, and the authors caution the result may not translate across tools or over time. |
| METR | 2025 | 16 devs | 19% more | Randomized trial measuring time per issue, across 246 real issues on mature repositories the developers had known for around five years. The same developers believed they were 20% faster. METR now labels the result out of date. |
| GitClear | 2025 | 211M | No time figure | Corpus analysis of 211 million changed lines, 2020 to 2024. Cloning rose while refactoring collapsed. Correlational and industry-wide, not a controlled attribution to AI. |
| DORA | 2025 | 5,000 pros | No time figure | Survey of nearly 5,000 technology professionals, covering adoption, throughput and stability. Throughput up, stability down. An association, not a cause. |
That last column is what turns a list of numbers into a method for reading numbers.
The studies disagree because they measure different constructs, on different codebases, with different seniority mixes. Peng measured time on one greenfield JavaScript task. METR measured time per issue on mature repositories the developers had known for about five years.
Cui measured tasks completed, a throughput construct rather than a speed one. Ask which of those most resembles your team's work and the range stops being confusing. Greenfield work in a familiar language behaves like Peng; a decade-old service behaves like METR.
Seniority is the finding most rollouts ignore. Gains concentrated in the less experienced engineers, who both adopted the tool more and got more from it (Cui et al., 2025, Management Science). Which makes "the seniors will work it out themselves" the least supported assumption in a typical enterprise rollout.
The largest measured effect in this body of research is a perception effect, and nobody in this market has named it. METR's developers believed AI had made them 20% faster while measurably running 19% slower - a gap of roughly 39 points, in the direction of flattery.
It gets worse when you ask people directly. A METR survey of 349 technical workers returned a median self-reported speed gain of 3x, and METR warn that survey results are "not necessarily grounded in reality," citing their own finding that people overestimated AI's effect on their task time by 40 percentage points on average.
So the instrument most leaders reach for is the one instrument with a documented 40-point error. That does not make surveys worthless, because developer experience is real and worth measuring. It makes them the wrong instrument for the one question the CFO is actually asking.
METR's own February 2026 update states plainly that the 2025 results are out of date, which matters because that -19% is still quoted across this market as a live fact. Their newer data puts returning developers at -18% (confidence interval -38% to +9%) and newly recruited developers at -4% (CI -15% to +9%), and METR judges this an unreliable signal of the true current effect.
The reason is the most honest sentence in software engineering right now. Developers increasingly refuse to participate in a study that requires them to work without AI, so METR is changing its experiment design. The best-resourced independent evaluator in the field cannot cleanly run the study, because the subjects won't give up the tool.
If a randomized trial run by specialists cannot answer this from the outside, a VP Engineering will not answer it from a throughput chart. The answer has to be constructed locally, on purpose, by someone who has done it before.
To baseline an AI rollout, decide what "faster" means before you look at any data - then capture the pre-period, write down what would falsify your claim, and keep a comparison cohort. Measuring developer productivity under AI is a design problem before it is a tooling problem, and four of these five steps become impossible the moment the tool goes live.
Step one determines everything downstream, and no dashboard makes it for you. Choosing between review cycle time and deploy frequency is a judgment about what your organization is actually short of, and getting it wrong wastes two quarters. It is worth an hour with someone who has designed this measurement before - an internal staff engineer with the scars, or an agentic coding mentor who has run the rollout elsewhere.
Measured gains are achievable, which is worth saying because the honest picture above can read as nihilism. A 12-month deployment across 300 engineers recorded a 31.8% reduction in PR review cycle time (Kumar et al., 2025). It was observational rather than randomized and the authors were evaluating their own platform, so treat it as an existence proof, not a forecast.
Two retrospective moves are still open, and most engineering leaders need them, because most already rolled out and captured nothing. The first is same-engineer retrospective comparison. Source control is a partial baseline you already own, so cycle time, review latency, and change failure rate are all reconstructable from git history and the incident log.
The second is cohort comparison. Teams that adopted late are a usable control group against teams that adopted early, provided you can argue the two groups were comparable to begin with.
Then the honest limit. The perceptual baseline is gone for good, because you cannot ask someone in 2026 how they felt about their workflow in 2025. METR's research is the reason that is the measurement you will most wish you had taken.
A defensible AI ROI claim has five parts, and a number that survives challenge is worth more in that meeting than a big number that doesn't. Most engineering leaders walk in with a chart. What a CFO is actually testing is whether the chart would have looked different if the investment had failed.
Build the claim like this.
Then calibrate the expectation before the meeting rather than during it. Most organizations should expect single digits to low teens on PR throughput. DX, which sells measurement tooling, reports a median 7.76% PR throughput increase across more than 400 companies where AI usage rose 65%, and a typical range of 5% to 15%.
That is vendor first-party data about the category DX sells into, not neutral research. It is still the best calibration anchor available, because time savings are the easiest thing to overstate and the hardest to prove.
Do the arithmetic honestly and it holds up fine. A 10% throughput gain across a large engineering org is real money, and it is defensible. A 10x gain is not on offer, and claiming one in front of a CFO is how an engineering leader loses the room for a year.
The cost side is where an AI training ROI case usually falls apart, and for a strange reason. Not one of the platforms offering to bring rigor to your ROI will tell you what they cost without a sales call. MentorCruise publishes its prices - from $250 for a two-hour session - which makes the line item easy to defend against a six-figure annual seat bill.
If the real question turns out to be org design rather than tooling, that is a job for an engineering management mentor or an AI strategy workshop for leaders.
"They'll figure the tools out themselves" is a bet, and DORA's 2025 research tells you exactly what you are betting on. The finding is worth quoting in full: "AI doesn't fix a team; it amplifies what's already there. Strong teams use AI to become even better and more efficient. Struggling teams will find that AI only highlights and intensifies their existing problems."
An amplifier is not a neutral object. Point it at strong review practice and fast feedback loops and you get one outcome; point it at weak testing and slow reviews and you get a louder version of that. Doing nothing is still a decision about where the amplifier points, made by default rather than on purpose.
The seniority evidence sharpens it. Gains concentrated in the less experienced developers across Cui et al.'s 4,867-person sample, which means the group most rollouts assume will self-serve is the group getting least from the tool.
Here is what MentorCruise will not claim. A MentorCruise workshop does not produce a specific productivity lift, because nobody has evidence for a claim like that, including MentorCruise - which is rather the point of everything above. The defensible claim is narrower - an expert who has designed this measurement before will help an engineering team pick the metric that matters, build a baseline that survives challenge, and read the result honestly.
Which is why the person in the room matters more than the format. MentorCruise accepts 8% of applicants as workshop hosts. Ask any provider for their acceptance rate - most cannot give you one, which tells you the screening is a conversation rather than a standard.
And the 97% satisfaction rate quoted on this page measures the session, not the delivery outcome. That distinction is the argument of this entire page, and it applies to MentorCruise too.
Match the format to the job honestly.
If the measurement says the tools are fine and the practice around them is not, the onward path runs through a Cursor workshop for teams or a Claude Code workshop for teams. If the gap turns out to be systemic, it runs through AI transformation for teams.
No, not as your only instrument. Self-report is a good instrument for developer experience and a documented failure for speed. METR's May 2026 survey of 349 technical workers found a median self-reported 3x speed gain, and METR warn the results are "not necessarily grounded in reality." Use surveys for how the work feels, never for how fast it is.
Partly, yes. Your repository already holds the record - review latency, cycle time, and change failure rate can all be rebuilt from version control and the incident log. Compare each person against their own pre-AI history rather than a team average. What cannot be rebuilt is the perceptual baseline: nobody in 2026 can reliably tell you how their 2025 workflow felt.
Set the range before the meeting rather than during it. A number that survives challenge beats a big number, and the honest expectation is single digits to low teens on PR throughput. Ten percent across a large engineering org is a number a CFO can bank, and it will hold up under questioning. Walking in implying 10x will not, and the credibility you spend there is expensive to earn back.
It depends on who you mean. The assumption that senior engineers will self-serve is the least supported assumption in a typical rollout, because Cui et al. (2025) found the gains concentrated in less experienced developers. Which makes the seniors the weaker bet. MentorCruise screens workshop hosts to an 8% acceptance rate, which is worth checking against any provider you consider.
No, not to start. You need a named metric, a stated pre-period, a comparison method, and a stability counter-metric reported alongside the speed number. A platform automates collection, and that is worth paying for at scale. It does not judge what is worth collecting, and it cannot reconstruct a baseline you never captured. Worth noting that every commercial answer to this question comes from someone selling the instrument.
Our hosts are experienced professionals from leading companies who bring real-world expertise to every session. Here's a sample of who's available.
See all our corporate training programs – AI tools, leadership, sales, marketing and more.
Reviews
Andrei has been an amazing mentor, helping me navigate the challenges of managing an engineering team, modernising our legacy SaaS platform and moving us into the era of AI software development.
Patrick
Director, Strategic Projects

Alessandro taught me to use competency matrices as objective decision-making tools, challenge assumptions from my own teams, and translate technical language into management language for executive conversations.
Roman
Engineering Manager

Matthew helped me think through several tricky leadership moments – particularly around how to navigate executive relationships, clarify influence, and prepare for a high-stakes offsite. I left each session clearer, calmer, and more confident in how I was showing up at the executive level.
Kimmy
Director of Team Enablement
Ready when you are
Tell us your goals and team size. We'll match you with 2-3 vetted hosts within 48 hours.